Neuroimaging Research Group

Neuroimaging Research Group

Mission

The Neuroimaging Research Group includes more than 20 clinical and research faculty and staff, postdoctoral fellows, and medical and graduate students who examine the brain’s structure and function, in health and disease, from genes to behavior, to develop and apply innovative techniques for imaging, analyzing, and monitoring the brain in neurologic and psychiatric disease. 

We develop both precision medicine approaches for individual assessment and healing, and larger scale approaches to address neurologic and psychiatric disease. We research causes and treatments for brain disease and push the envelope of technology development in imaging modalities to guide the development and evaluation of novel therapies to create healthier futures for those suffering from brain tumors, neurodegenerative disorders (dementia, multiple sclerosis, Alzheimer’s, Parkinson’s, Huntington’s disease), neurological disorders (epilepsy, stroke, traumatic brain injury), psychiatric disorders (schizophrenia, depression), and hearing, speech, and voice disorders (deafness, tinnitus, laryngeal dystonia, stuttering).

Neuroimaging Research Directions

  • Next Generation MRI Technology
  • Non-Invasive Metabolic Imaging Biomarkers for Patients with Brain Tumors​
  • Multimodal MRI to Improve Neuromodulation Therapies 
  • Multimodal Neuroimaging in Progressive GBM Automated Post-Processing
  • Workflow for Spectral Processing and Quality Control

Neuroimaging Research Labs

Neuroimaging Research Labs Directors
Baby Brain Research Group Orit Glenn, MD
Biomagnetic Imaging Lab Srikantan Nagarajan, PhD
Brain Arteriovenous Malformations (bAVM) Daniel Cooke, MD / David Saloner, PhD
BrainChange Study Olga Tymofiyeva, PhD
Cancer Metabolic Imaging and Therapy Lab Pavithra Viswanath, PhD
Chaumeil Lab Myriam Chaumeil, PhD
Hyperpolarized MRI Technology Resource Center Dan Vigneron, PhD 
Imaging Research for Neurodevelopment Duan Xu, PhD
Lupo Lab Janine Lupo, PhD
Neuromodulation Imaging Lab Melanie Morrison, PhD
Multimodal Metabolic Brain Imaging Lab Yan Li, PhD
Sarah J. Nelson Lab  
Neural Connectivity Lab Pratik Mukherjee, MD, PhD
Neuroradiology Clinical Division Research  
Rauschecker-Sugrue Lab Andreas Rauschecker, MD, PhD / Leo Sugrue, MD, PhD
The Surbeck Laboratory for Advanced Imaging Dan Vigneron, PhD / Robert Bok MD, PhD
VA Advanced Imaging Research Center (VAARC) Pratik Mukherjee, MD, PhD / Duygu Tosun-Turgut, PhD
Wilson Lab David M. Wilson, MD, PhD

Neuroimaging Research Selected Publications

Spatial cell-type enrichment predicts mouse brain connectivity

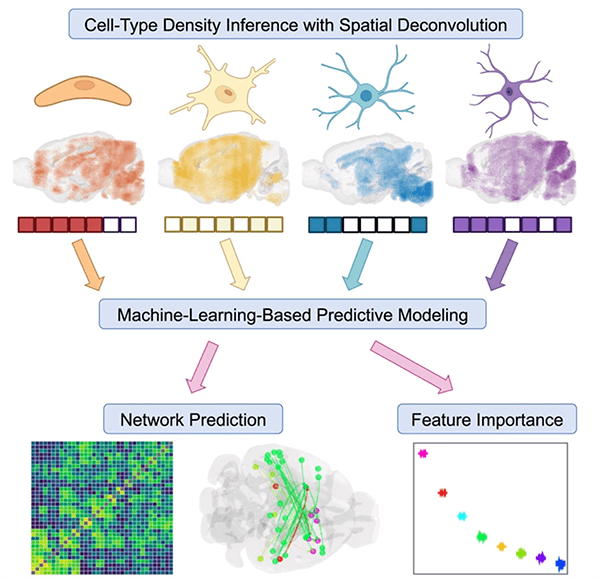
A fundamental neuroscience topic is the link between the brain’s molecular, cellular, and cytoarchitectonic properties and structural connectivity. Recent studies relate inter-regional connectivity to gene expression, but the relationship to regional cell-type distributions remains understudied. In a recent paper published in the prestigious journal Cell Reports from Dr. Ashish Raj’s Lab titled “Spatial cell-type enrichment predicts mouse brain connectivity”, examined the relationships between regional brain connectivity, gene expression data, and cell-type distributions. They utilized whole-brain mapping of neuronal and non-neuronal subtypes via the matrix inversion and subset selection algorithm, developed by then in an earlier publication, to model inter-regional connectivity as a function of regional cell-type composition with machine learning. They deployed random forest algorithms for predicting connectivity from cell-type densities, demonstrating surprisingly strong prediction accuracy of cell types in general, and particular non-neuronal cells such as oligodendrocytes. We found evidence of a strong distance dependency in the cell connectivity relationship, with layer-specific excitatory neurons contributing the most for long-range connectivity, while vascular and astroglia were salient for short-range connections. These results demonstrate a link between cell types and connectivity, providing a roadmap for examining this relationship in other species, including humans.

Graphical Abstract of Spatial cell-type enrichment predicts mouse brain connectivity from Dr. Ashish Raj’s lab.

Multi-parametric hyperpolarized 13C/1H imaging reveals Warburg-related metabolic dysfunction and associated regional heterogeneity in high-grade human gliomas

Dynamic hyperpolarized (HP)-13C MRI has enabled real-time, non-invasive assessment of Warburg-related metabolic dysregulation in glioma using a [1-13C] pyruvate tracer that undergoes conversion to [1-13C]lactate and [13C]bicarbonate. Using a multi-parametric 1H/HP-13C imaging approach, Dr. Yan Li’s lab investigated dynamic and steady-state metabolism, together with physiological parameters, in high-grade gliomas to characterize active tumor. In a recent paper published in the journal Neuroimage Clinical titled “Multi-parametric hyperpolarized 13C/1H imaging reveals Warburg-related metabolic dysfunction and associated regional heterogeneity in high-grade human gliomas”, they acquired multi-parametric 1H/HP-13C MRI data from fifteen patients with progressive/treatment-naïve glioblastoma [prog/TN GBM, IDH-wildtype (n = 11)], progressive astrocytoma, IDH-mutant, grade 4 (G4AIDH+, n = 2) and GBM manifesting treatment effects (n = 2). Regional analysis of Prog/TN GBM metabolism revealed statistically significant heterogeneity in 1H choline-to-N-acetylaspartate index (CNI)max, [1-13C]lactate, modified [1-13C]lactate-to-[1-13C]pyruvate ratio (CELval > NELval > NAWMval); [1-13C]lactate-to-[13C]bicarbonate ratio (CELval > NELval/NAWMval); and 1H-lactate (CELval/NELval > NAWMundetected). Significant associations were also found between normalized perfusion (cerebral blood volume, nCBV; peak height, nPH) and levels of [1-13C]pyruvate and [1-13C]lactate, as well as between CNImax and levels of [1-13C]pyruvate, [1-13C]lactate and modified ratio. GBM, by comparison to G4AIDH+, displayed lower perfusion %-recovery and modeled rate constants for [1-13C]pyruvate-to-[1-13C]lactate conversion (kPL), and higher 1H-lactate and [1-13C]pyruvate levels, while having higher nCBV, %-recovery, kPL, [1-13C]pyruvate-to-[1-13C]lactate and modified ratios relative to treatment effects. These results indicate that GBM consistently displayed aberrant, Warburg-related metabolism and regional heterogeneity detectable by novel HP-13C/1H imaging techniques.

Identifying individuals with non-Alzheimer's disease co-pathologies: A precision medicine approach to clinical trials in sporadic Alzheimer's disease

Imaging biomarkers remain mostly unavailable for non-Alzheimer's disease neuropathological changes (non-ADNC) such as transactive response DNA-binding protein 43 (TDP-43) proteinopathy, Lewy body disease (LBD), and cerebral amyloid angiopathy (CAA). A recent publication from Dr. Duygu Tosun’s group this year in the journal Alzheimer’s and Dementia titled “Identifying individuals with non-Alzheimer's disease co-pathologies: A precision medicine approach to clinical trials in sporadic Alzheimer's disease” addressed this problem. A multilabel non-ADNC classifier using magnetic resonance imaging (MRI) signatures was developed for TDP-43, LBD, and CAA in an autopsy-confirmed cohort (N = 214). A model using demographic, genetic, clinical, MRI, and ADNC variables (amyloid positive [Aβ+] and tau+) in autopsy-confirmed participants showed accuracies of 84% for TDP-43, 81% for LBD, and 81% to 93% for CAA, outperforming reference models without MRI and ADNC biomarkers. In an ADNI cohort (296 cognitively unimpaired, 401 mild cognitive impairment, 188 dementia), Aβ and tau explained 33% to 43% of variance in cognitive decline; imputed non-ADNC explained an additional 16% to 26%. Accounting for non-ADNC decreased the required sample size to detect a 30% effect on cognitive decline by up to 28%. These results lead to a better understanding of the factors that influence cognitive decline and may lead to improvements in clinical trial design for dementia patients.

Cortical synchrony and information flow during transition from wakefulness to light non-rapid eye movement sleep

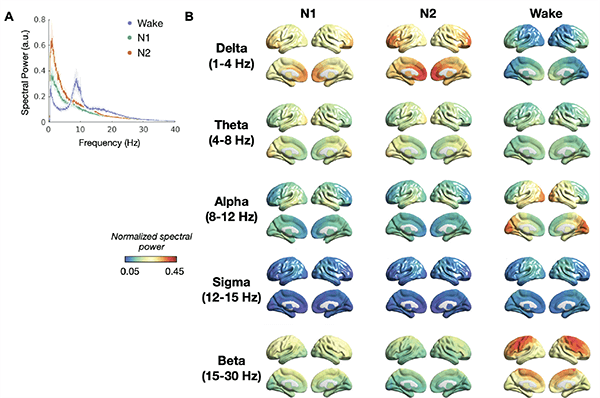
Sleep is a highly stereotyped phenomenon, requiring robust spatiotemporal coordination of neural activity. Understanding how the brain coordinates neural activity with sleep onset can provide insights into the physiological functions subserved by sleep and the pathologic phenomena associated with sleep onset. In a recent publication that is a collaboration between the laboratories of Drs. Nagarajan, Ranasinghe and Raj published in the Journal of Neuroscience titled “Cortical synchrony and information flow during transition from wakefulness to light non-rapid eye movement sleep”, they quantified whole-brain network changes in synchrony and information flow during the transition from wakefulness to light non-rapid eye movement (NREM) sleep, using magnetoencephalography imaging in a convenient sample of 14 healthy human participants (11 female; mean 63.4 y [SD 11.8]). They also performed computational modeling to infer excitatory and inhibitory properties of local neural activity. The transition from wakefulness to light NREM was identified to be encoded in spatially and temporally specific patterns of long-range synchrony. Within the delta band, there was a global increase in connectivity from wakefulness to light NREM, which was highest in fronto-parietal regions. Within the theta band, there was an increase in connectivity in fronto-parieto-occipital regions and a decrease in temporal regions from wakefulness to N1. Patterns of information flow revealed that mesial frontal regions receive hierarchically organized inputs from broad cortical regions upon sleep onset, including direct inflow from occipital regions and indirect inflow via parieto-temporal regions within the delta frequency band. Finally, biophysical neural mass modeling demonstrated changes in the anterior-to-posterior distribution of cortical excitation-to-inhibition with increased excitation-to-inhibition model parameters in anterior regions in light NREM as compared to wakefulness. Together, these findings uncover whole-brain corticocortical structure and the orchestration of local and long-range, frequency-specific cortical interactions in the sleep-wake transition.

Spatial maps of local neural synchrony across sleep-wake states. A) Mean synchrony across regions in wake (purple), N1 (green) and N2 (orange) sleep states. B) Frequency specific spatial maps of regional local neural synchrony across the sleep-wake states.

Members of the Neuroimaging Research Group